
Global IoT deployments are built to move. Devices cross borders inside shipping containers, fleets travel across continents, and infrastructure expands into new markets every quarter. Connectivity makes this possible. Billing complexity threatens to slow it down.
When your SIM footprint stretches across 50, 80, or 100+ countries, data pricing stops being a simple line item. It becomes a variable landscape shaped by roaming agreements, local carrier rates, currency differences, taxation rules, and usage behavior. Without a strategy, invoices turn into surprises. With the right structure, billing becomes predictable, measurable, and optimized.
Borderless billing is not about eliminating cost. It is about designing a system where cost behaves logically, even when your devices do not stay in one place.
The Three Forces Behind Global IoT Costs
Before you can control billing, you must understand what drives it. Across international IoT deployments, three primary forces determine your data spend.
1. Geography
Data costs vary dramatically by country. Mature telecom markets with competitive carriers may offer lower rates. Remote or smaller markets may carry higher roaming costs. Regulatory frameworks and wholesale agreements influence pricing behind the scenes.
2. Usage Behavior
Not all devices behave the same way. Some transmit kilobytes per day. Others push megabytes per hour. Firmware updates, retries due to weak signal, and unexpected application changes can dramatically increase consumption.
3. Network Routing
In some cases, data travels further than expected. Roaming configurations may route traffic through a home network in another country before reaching the cloud. This can increase latency and cost simultaneously.
Understanding these variables is the first step toward building a predictive billing model.
Building a Predictable Cost Formula
At scale, billing should never rely on guesswork. A simple forecasting framework helps organizations estimate and monitor global data spend.
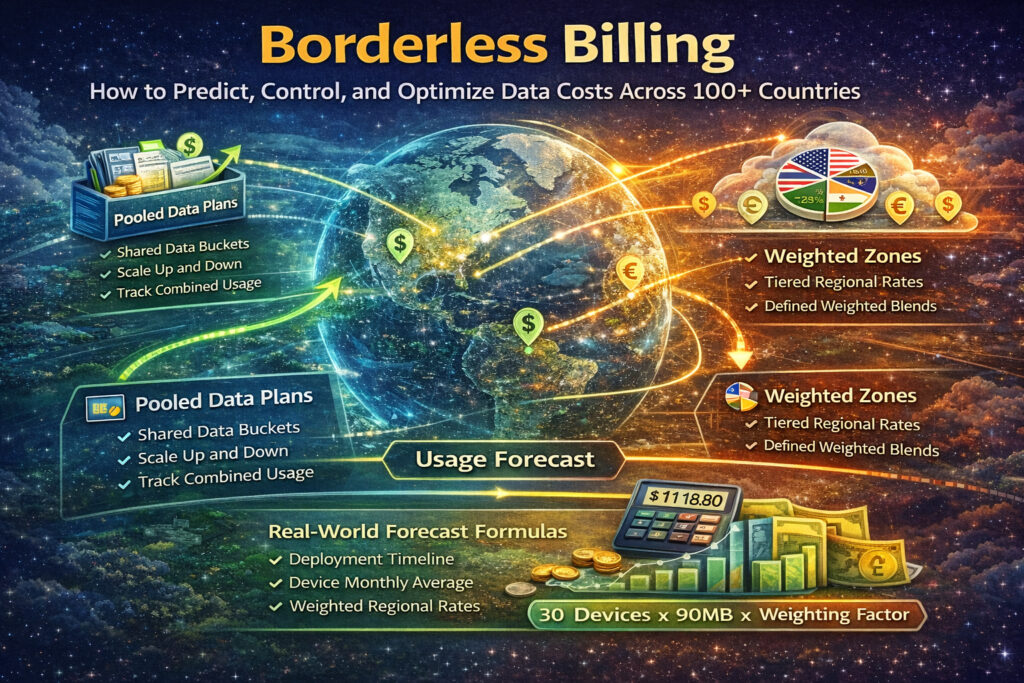
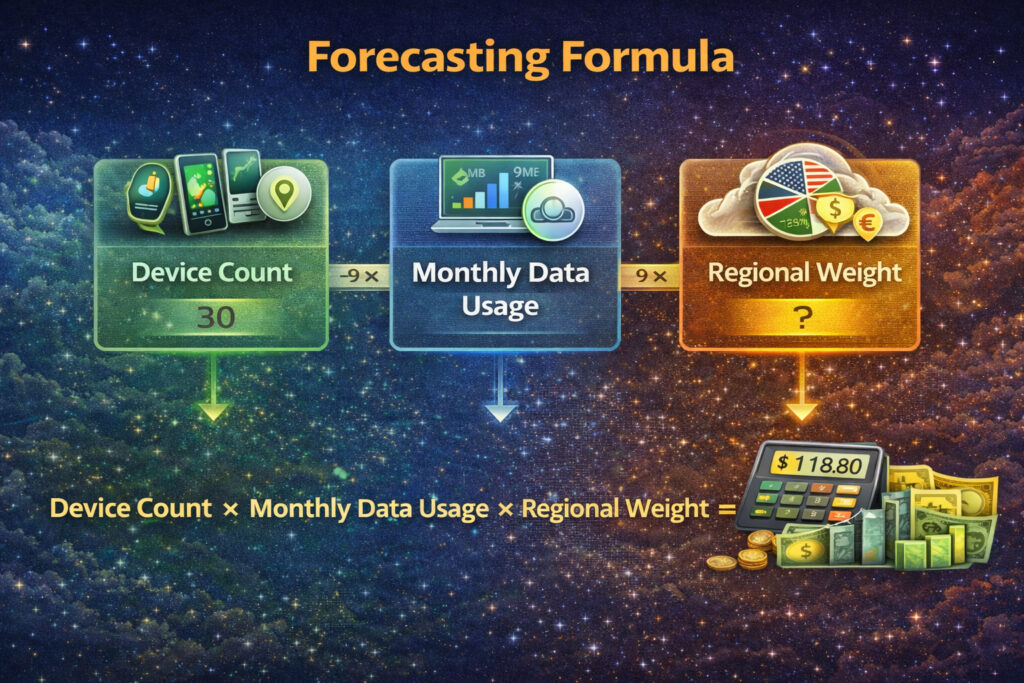
A practical forecasting formula looks like this:
Total Monthly Data Cost = (Average Data per Device × Number of Active Devices × Regional Rate) + Platform Fees
Breaking it down:
- Average Data per Device (MB): Calculated using historical usage data
- Number of Active Devices: Adjusted for activation trends and seasonal fluctuations
- Regional Rate ($/MB): Weighted average across the countries in which devices operate
- Platform Fees: SIM management, support, and service charges (NOTE: OneSimCard IoT has NONE of these fees. You only pay for usage!)
To refine accuracy, organizations often segment devices into usage tiers:
- Low usage: <5 MB per month
- Medium usage: 5–50 MB per month
- High usage: 50+ MB per month
Forecasting becomes more precise when each segment is modeled separately.
The Power of Pooled Data Plans
One of the most effective tools in borderless billing is pooled data.
Instead of assigning strict data limits to each SIM, pooled plans allow a group of devices to share a collective data allowance. High-usage devices draw more from the pool. Low-usage devices draw less. The overall balance smooths unpredictability.
For example:
If 1,000 devices each have a 10 MB limit, the total theoretical usage is 10,000 MB. In reality, only a portion may reach that limit. With pooling, unused capacity from low-consumption devices offsets heavier users.
The benefits include:
- Reduced overage charges
- Improved budget predictability
- Simplified plan management
Pooling is particularly effective for fleets and geographically diverse deployments where usage varies by environment.
Usage Forecasting: Turning History into Strategy
Historical usage data is one of the most valuable assets in cost optimization.
Effective forecasting requires analyzing:
- Monthly data growth trends
- Seasonal spikes
- Firmware update cycles
- Geographic expansion patterns
A common forecasting method involves calculating rolling averages over three- or six-month periods to smooth anomalies. Growth multipliers can then be applied based on business expansion plans.
For example:
If usage has grown 8 percent quarter over quarter and 5,000 new devices are scheduled for activation, projected data consumption should account for both organic growth and new deployments.
Forecasting is not about perfect prediction. It is about narrowing uncertainty.
Real-Time Monitoring Prevents Billing Shock
Even the best forecasts can fail if monitoring is absent.
Modern IoT SIM management platforms provide real-time visibility into data consumption. Instead of discovering overages at the end of the billing cycle, operators can set thresholds that trigger alerts when devices approach expected limits.
Alert examples include:
- Device exceeds projected usage by 25 percent
- Unusual spike in a specific country
- SIM attaching outside approved geographic regions
Early detection allows teams to investigate root causes before costs escalate.
| Feature | Per-SIM Plans | Pooled Global Plans |
|---|---|---|
| Billing Structure | Each SIM has its own fixed data allowance or just pay per MB used at agreed upon rate | Multiple SIMs share a collective data bucket |
| Cost Predictability | Predictable per device, but vulnerable to overages and per country tariff rates | Predictable at fleet level, smoother usage distribution |
| Overage Risk | High if individual devices exceed limits | Lower, excess usage balanced across pool |
| Scalability | Requires plan adjustments per SIM | Easily scales by expanding pool size |
| Administrative Overhead | Higher — manage limits individually | Lower — manage usage at group level |
| Best For | Small, static deployments | Large, dynamic, multi-country deployments |
| Cost Efficiency at Scale | Can become expensive with uneven usage | More efficient when device usage varies |
| Global Expansion | Requires region-by-region plan mapping | Centralized cost structure across countries |
| Usage Visibility | Per-device monitoring required | Fleet-level analytics with device drill-down |
| Budget Forecasting | Simple at small scale | More accurate at enterprise scale |
Geographic Cost Weighting
When devices operate across many countries, weighted averages help simplify modeling.
Example:
If 40 percent of devices operate in Region A at $0.01/MB and 60 percent operate in Region B at $0.015/MB, the weighted average rate becomes:
(0.4 × 0.01) + (0.6 × 0.015) = $0.013/MB
This blended rate provides a more realistic basis for forecasting than assuming a single uniform cost.
As deployments shift geographically, the weighted rate should be recalculated quarterly.
Controlling Costs Through Policy Automation
Predictability increases when billing controls are automated.
Examples of cost-control policies include:
- Automatic throttling after defined thresholds
- Temporary suspension after extended inactivity
- Country-based activation restrictions
Automation reduces manual oversight and ensures cost discipline remains consistent across thousands of SIMs.
The Role of Multi-Network SIM Strategies
Multi-network IoT SIMs can also influence billing efficiency.
By connecting devices to stronger local networks, they reduce retransmissions caused by weak signal strength. Fewer retries mean lower data consumption.
Local breakout routing can also shorten data paths, potentially reducing roaming inefficiencies.
Connectivity design directly affects cost behavior.
Negotiation and Scale Leverage
As deployments grow, organizations gain negotiating leverage.
Volume-based pricing, committed data agreements, and regional bundles can significantly reduce per-megabyte costs. Understanding your usage distribution strengthens your position during pricing discussions.
Transparency in usage analytics transforms negotiation from speculation into data-backed strategy.
Managing Currency and Tax Complexity
Operating across 100+ countries introduces currency fluctuations and varying tax structures.
Centralized billing in a single currency simplifies accounting. Some organizations also model costs using conservative exchange rate buffers to protect against volatility.
Consistency in billing structure is as important as rate optimization.
From Cost Center to Strategic Asset
Borderless billing should not be reactive. It should be engineered.
When forecasting models, pooled plans, automation policies, and real-time monitoring work together, billing becomes predictable and controllable. Instead of reacting to invoices, teams can make informed decisions about expansion, product pricing, and operational efficiency.
Connectivity cost is no longer a mysterious variable. It becomes a managed metric aligned with business growth.
The Final Equation
Operating across 100+ countries introduces complexity, but complexity does not have to mean chaos.
With the right formulas, pooled structures, and visibility tools, global IoT billing can be forecasted, optimized, and scaled confidently.
Borderless billing is ultimately about turning geography into math and unpredictability into strategy. When your data costs behave as logically as your devices do, global expansion becomes not just possible, but sustainable.